Make a Boundary Map With Spreadsheet Data
In an increasingly data-driven world, understanding geographical patterns can reveal insights that spreadsheets simply can’t. Whether it’s population density, economic growth, or consumer trends, representing data across regions allows for quick comprehension and powerful analysis.
This is where the choropleth, or boundary, map truly shines. A choropleth map is a type of thematic map where predefined geographic areas, such as states, counties, or zip codes, are shaded or colored in proportion to a statistical variable. This visual approach transforms complex numbers into a clear, intuitive display. They make it easy to identify hotspots, outliers, and overarching distributions at a glance.
In this article, we’ll show you how BatchGeo makes it incredibly easy to take your own regional data and transform it into a compelling choropleth-like boundary map. You’ll learn how to set up your data, upload it to BatchGeo, and customize your map to reveal fascinating insights about any geographically-based dataset.
What data should we use? Well, if you were to ask 10 people what makes a house feel like a home, how many would say it’s their pet? And of those, how many actually have a pet? Do they prefer cats or dogs? That number likely varies by state as well.
So how do we show that? If you said a “boundary map”, you’re absolutely correct! A boundary map lets us instantly spot fascinating variations from state to state.
Start With the Data
The first step in creating any powerful map is preparing your data. For a boundary map to work effectively, you need two key pieces of information for each entry: a geographic identifier and a descriptive value.
The geographic identifier tells the map where to apply the data, while the descriptive value tells it how to shade or color that area.
For our pet ownership map, we gathered data on the percentage of households in each U.S. state that own pets, as well as the percentage with cats or dogs specifically. This means our geographic identifier is the state name, and our descriptive value is the percentage of households with pets.
Interactive Maps Made Easy
Sign Up NowWhen you’re preparing your data, make sure it’s organized in a spreadsheet format, with clear column headers. You’ll want two columns:
- Geographic regions (e.g. State, County, or Zip Code)
- The numerical data you want to visualize (e.g. Percentage of Households, Sales Volume, or Population Density.
Consistency in your geographic identifiers is crucial. For example, if you’re using state names, make sure they’re uniform:
- Good: California, Washington, New York
- Bad: CA, Washington, NY
Make Your Map
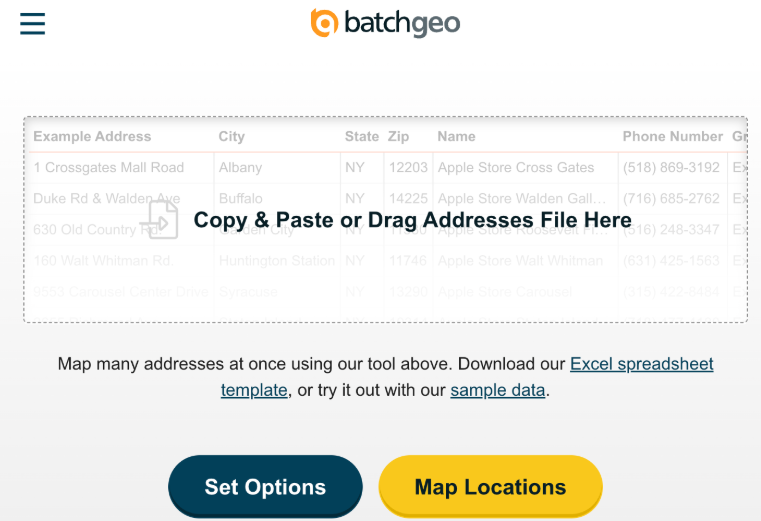
With BatchGeo, creating your map is as easy as uploading a CSV. You can select the file, drag and drop it, or copy and paste it.
Once your file is uploaded, select Set Options.
For this example, these are the options set for the map.
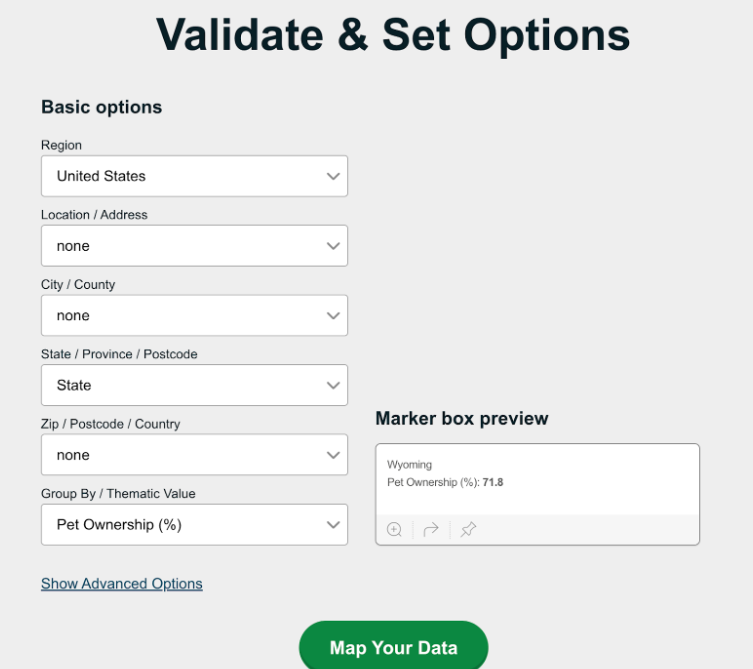
After you’ve set your options, you’ll Map Your Data.
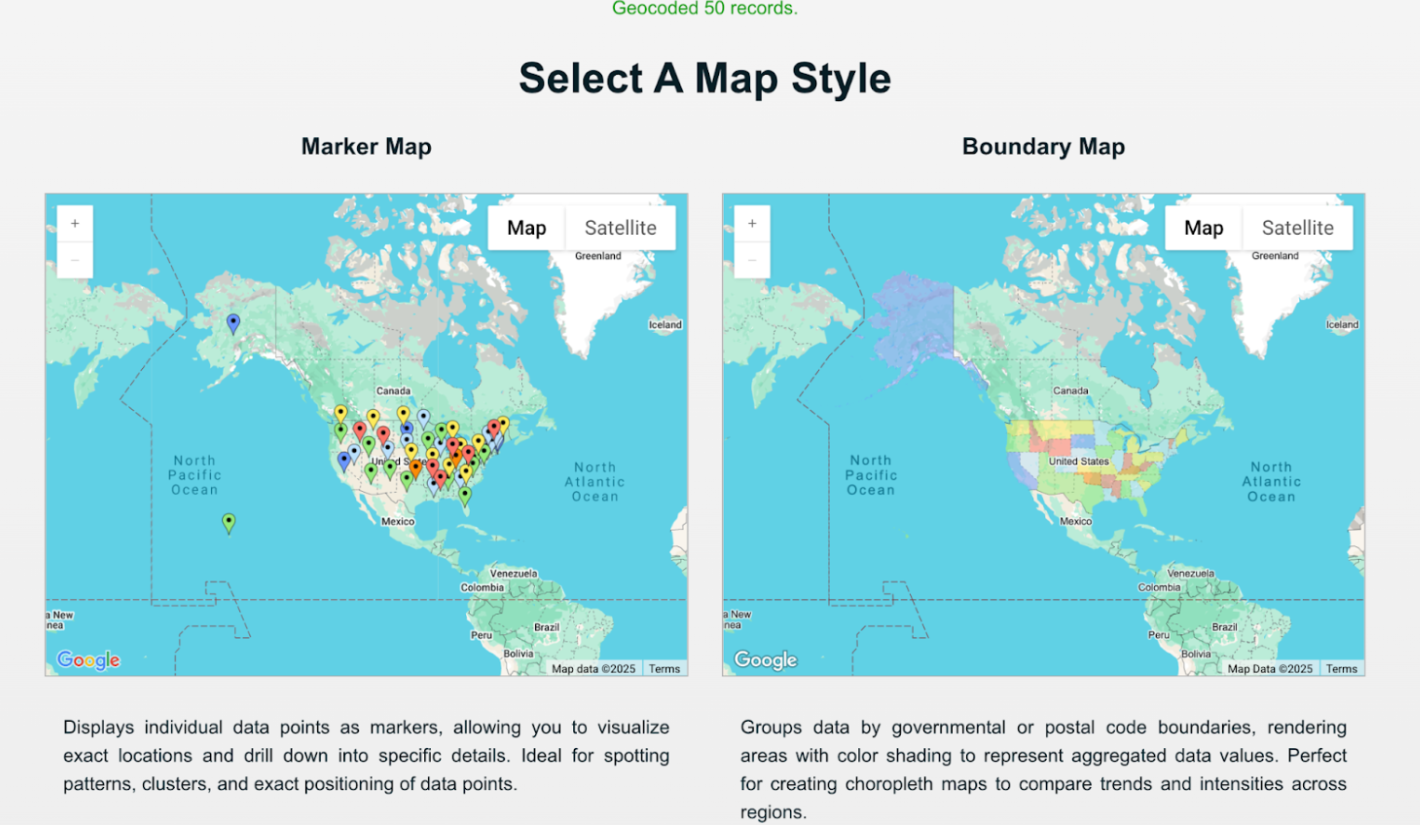
Choose Your Formatting
This is the step that defines your map as a boundary map and it’s as easy as selecting the map style you want to use.
After you’ve created your map, take a look at it and admire your new visualization. Check out our example below.
View Percent of households in the US with a pet in a full screen map
You don’t have to have a percentage to use a boundary map either. If you simply want to color in a full geographic location rather than using a marker, this is the map style for you. For comparison, the map below shows whether cats or dogs are more popular.
As it turns out, the US overwhelmingly prefers dogs.
View Are Cats or Dogs More Popular as Pets in a full screen map
Make A Choropleth-like Boundary Map Today
Make your own Boundary Map today using BatchGeo. BatchGeo is your fastest way to make a custom map. We’ve just shown you how easy it is, so try it today for free!